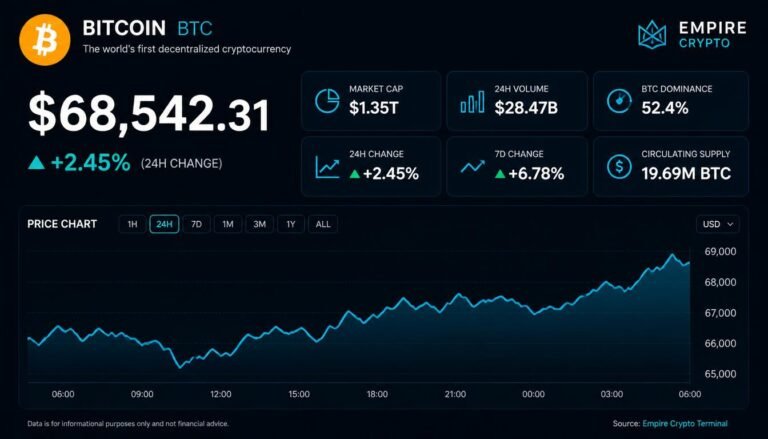
This hub is built specifically for new learners. It breaks down the core data structures, market metrics, and analytical tools you need to transition from a Crypto Data Online spectator to an informed observer. Let’s peel back the layers step-by-step.

1. Foundation: The Mechanics of Blockchain Data
To understand cryptocurrency data, you must first understand where it lives. Unlike traditional financial data, which is locked behind the closed doors of private banks and institutions, crypto data lives on a blockchain—a public, decentralized, digital ledger.
Every transaction ever made is bundled into a “block” and permanently chained to the previous block. Because this ledger is public, it creates a unique form of data transparency called On-Chain Data.
Public vs. Private Infrastructure
Think of traditional banking data like a private diary. Only the bank can see all the transactions moving through its system. Crypto data, on the other hand, is like a glass piggy bank sitting in the middle of a town square. Anyone can walk up and see exactly how much money went in, how much went out, and when it happened—without knowing the real-world identity of the person who owns the piggy bank.
Node Networks and Validation
Blockchains stay accurate because thousands of computers, called nodes, maintain identical copies of the ledger. When someone sends crypto, nodes verify that the sender actually has the funds. Once a consensus is reached, the transaction is written into a new block. This absolute transparency is what gives crypto data its raw power.
2. Core Cryptocurrencies: Bitcoin vs. Ethereum
While there are thousands of digital assets, the entire market is anchored by two dominant networks. Understanding their data structures helps you read the rest of the market.
       ┌────────────────────────────────────────────────────────┐
       │              THE TWO CRYPTO PILLARS                    │
       └───────────────────────────┬────────────────────────────┘
                                   │
         ┌─────────────────────────┴─────────────────────────┐
         ▼                                                   ▼
┌──────────────────┐                                ┌──────────────────┐
│     BITCOIN      │                                │     ETHEREUM     │
├──────────────────┤                                ├──────────────────┤
│ • Digital Gold   │                                │ • Global Comput. │
│ • Fixed Supply   │                                │ • Programmable   │
│ • Simple Tx Data │                                │ • Complex Smart  │
│   (Value Transfer)                                │   Contract Data  │
└──────────────────┘                                └──────────────────┘
Bitcoin (BTC): Digital Gold
Bitcoin was created to be a peer-to-peer digital cash system, but it has evolved into a digital store of value.
- Data Characteristic: High scarcity. Bitcoin’s code dictates that there will only ever be 21 million Bitcoins created.
- The Halving: Roughly every four years, an event called “the halving” cuts the amount of new Bitcoin awarded to miners in half. This data-driven supply shock historically triggers major market cycles.
Ethereum (ETH): The Decentralized Application Layer
Ethereum isn’t just a currency; it’s a programmable software platform.
- Data Characteristic: Complex execution. Instead of just tracking “Person A sent 1 BTC to Person B,” Ethereum’s data tracks Smart Contracts—self-executing code that runs automatically when certain conditions are met.
- Gas Fees: To execute actions on Ethereum, users pay a variable transaction fee called “Gas” in ETH. Monitoring gas data tells us exactly how busy and in-demand the network is at any given second.
3. High-Level Market Metrics Explained
When you visit a crypto data website (like CoinMarketCap or CoinGecko), you are immediately hit with an array of numbers. Here are the four foundational metrics you must master.
Market Capitalization (Market Cap)
Market Cap is the total dollar value of a cryptocurrency’s circulating supply. It is calculated with a simple formula:
$$\text{Market Cap} = \text{Current Price} \times \text{Circulating Supply}$$
New learners often make the mistake of looking only at a coin’s price. For example, a coin priced at $1 with a supply of 10 billion coins has a Market Cap of $10 billion. It is a much “larger” asset than a coin priced at $100 with a supply of only 10,000 coins (which has a Market Cap of $1 million). Always use Market Cap, not unit price, to judge a cryptocurrency’s true size.
24-Hour Trading Volume
Volume measures how much of a specific cryptocurrency was bought and sold within the last 24 hours. High volume means an asset is highly liquid and easily tradeable. Low volume means fewer people are trading, which can lead to extreme price swings if a large buyer or seller enters the market.
Circulating Supply vs. Max Supply
- Circulating Supply: The number of coins currently active and tradeable in the public market.
- Max Supply: The absolute hard cap of coins that will ever exist (like Bitcoin’s 21 million).
Warning for Beginners: If a cryptocurrency has a circulating supply of 1 million coins but a max supply of 100 million coins, it means 99% of the supply is still locked up. When those locked coins are eventually released into the market, they can heavily dilute the value of your tokens.
Market Dominance
Market Dominance tracks what percentage of the entire crypto market cap belongs to a single coin. It is typically calculated for Bitcoin:
$$\text{Bitcoin Dominance} = \left( \frac{\text{Bitcoin Market Cap}}{\text{Total Crypto Market Cap}} \right) \times 100$$
When Bitcoin Dominance rises, it means capital is flowing out of riskier alternative assets (Altcoins) and into the relative safety of Bitcoin. When it falls, it often signals that investors are feeling adventurous and moving money into smaller, higher-risk altcoins.
4. Introduction to On-Chain Metrics
Because all blockchain data is public, analysts can study network health and investor behavior in real-time. This is called On-Chain Analytics, pioneered by platforms like Glassnode and CryptoQuant. Here are three key on-chain indicators.
1. Exchange Inflows and Outflows
By tracking the digital wallets known to belong to centralized exchanges (like Binance or Coinbase), analysts can watch the physical flow of crypto.
- High Exchange Inflows: When massive amounts of crypto are transferred onto exchanges, it usually means investors are preparing to sell. This increases supply and often acts as a bearish indicator.
- High Exchange Outflows: When investors pull their crypto off exchanges and into private cold-storage wallets, it means they intend to hold long-term. This reduces immediate selling pressure and is a bullish indicator.
2. MVRV Ratio (Market Value to Realized Value)
The MVRV ratio is a powerful tool used to calculate whether the market is overall overvalued or undervalued.
- Market Value: The current price multiplied by supply (Standard Market Cap).
- Realized Value: Instead of using today’s price, Realized Value looks at the price of each individual coin the last time it moved on the blockchain. This acts as a measure of the average aggregate cost basis of all holders.
An MVRV score above 3.0 historically signals market tops (extreme greed/overvaluation). An MVRV score near or below 1.0 indicates that the current price is very close to what people actually paid for their coins, historically highlighting long-term market bottoms and accumulation zones.
3. Active Addresses
This metric tracks the number of unique blockchain addresses participating in a transaction on a given day. Steady growth in active addresses means real network adoption is increasing. If a coin’s price is skyrocketing but its active addresses are flat or falling, the price increase might be driven purely by speculative hype rather than genuine organic utility.
5. Technical vs. Fundamental Analysis
To interpret all this data, the crypto world splits analysis into two core schools of thought.
| Dimension | Fundamental Analysis (FA) | Technical Analysis (TA) |
| Core Question | “What is this asset actually worth?” | “What will the price do next based on history?” |
| Data Evaluated | Whitepapers, developer activity, network security, regulatory environment, token supply schedules. | Price charts, trading volume, mathematical patterns, historical support and resistance levels. |
| Time Horizon | Long-term (months to years). | Short-to-medium term (minutes to weeks). |
| Key Tools | On-chain metrics, macroeconomics, user growth metrics. | Moving averages, RSI (Relative Strength Index), MACD. |
The most successful market participants do not choose one over the other; they use Fundamental Analysis to find what asset is high quality, and Technical Analysis to help determine when to buy or sell it.

6. Tokenomics and Evaluating a Project
Before putting a single dollar into a crypto project, you must inspect its Crypto Data Online (Token Economics). This is the structural blueprint of how a specific token functions, behaves, and distributes value.
The Allocation Breakdown
When a new project launches, its tokens are divided among different groups. A healthy project typically allocates a large portion to public rewards, ecosystem growth, and a reasonable piece to the founding team. Be wary of projects where the founders or private early investors hold more than 30% to 40% of the total supply—they hold enough structural power to crash the price if they decide to sell all at once.
Vesting Schedules and Cliff Periods
Early investors and teams are usually subject to a vesting schedule, meaning their tokens unlock slowly over time.
- The Cliff: A period (e.g., 1 year) where zero tokens are unlocked.
- Once the cliff passes, a massive wave of tokens might flood the market. Checking a project’s vesting data allows you to anticipate these supply expansions and protect your portfolio from sudden price drops.
7. Essential Tools & Platforms for New Learners
You do not need to build complex data scrapers to read crypto data. The industry has highly accessible, free tools that do the heavy lifting for you.
1. Market Aggregators
- CoinMarketCap & CoinGecko: Your daily dashboard. Use these to check current prices, market caps, official website links, token contract addresses, and lists of valid exchanges where a coin can be traded safely.
2. On-Chain Analytics Dashboards
- DeFiLlama: The premier directory for decentralized finance data. It tracks TVL (Total Value Locked), which reveals exactly how much capital is deposited inside different smart contracts and financial protocols.
- CryptoQuant & Glassnode: Excellent for tracking institutional bitcoin flows, miner behaviors, and exchange health metrics.
3. Blockchain Explorers
Every major network has its own search engine. For Bitcoin, it is Blockchain.com; for Ethereum, it is Etherscan.
- By pasting any public wallet address or transaction ID into an explorer, you can see its exact history, token balances, and transaction statuses in real-time. This is the ultimate tool for verifying claims and auditing transactions yourself.
8. Basic Security and On-Chain Hygiene
Because cryptocurrency data is decentralized, there is no corporate customer service hotline to call if you make an error. Security is entirely your responsibility.
Hard Rules of Crypto Safety
- Never Share Your Seed Phrase: Your seed phrase (a string of 12 to 24 random words) is the private cryptographic master key to your funds. No legitimate developer, support representative, or exchange will ever ask for it. Write it on paper and hide it physically; never save it as a photo on your phone or in a cloud document.
- Double-Check Contract Addresses: Scammers often create fake tokens with the exact same name as popular projects. Before interacting with a decentralized application, copy the official token contract address directly from a trusted aggregator like CoinGecko and verify it matches.
- Test with Small Amounts: Before sending a large transfer across the blockchain, always send a tiny “test transaction” first. Once you confirm the small amount arrived safely at the destination address, you can confidently send the rest of your funds.
Summary Data Checklist for Beginners
Whenever you evaluate a new cryptocurrency token, run through this quick checklist to ensure you have verified its core data metrics:
- [ ] What is the Market Cap? (Is it a large, stable asset or a volatile micro-cap?)
- [ ] What is the circulating supply versus max supply? (Are there massive token unlocks coming?)
- [ ] Is trading volume healthy? (Can I easily buy and sell this without moving the market price?)
- [ ] Where is the token traded? (Is it available on highly regulated, liquid exchanges?)
- [ ] What do the active addresses look like? (Are real people actually using the network?)
By shifting your focus away from emotional hype and anchoring your decisions in verifiable blockchain metrics, you will drastically shorten your learning curve and navigate the crypto ecosystem safely.